6 Data and Space
Prediction models need information stored as input/output pairs. To predict the diagnosis of a tumour based on its characteristics, these models require many examples of tumour characteristics and tumour diagnosis pairs.
This collection is called a dataset, or a data sample. Data refers to any information being recorded and stored. From its Latin origin, it means “what is given”.
From the point of view of the practitioner, data is rarely given, it is earned with sweat and tears. A sacrifice worth making, as a prediction model is only as good as its training data.
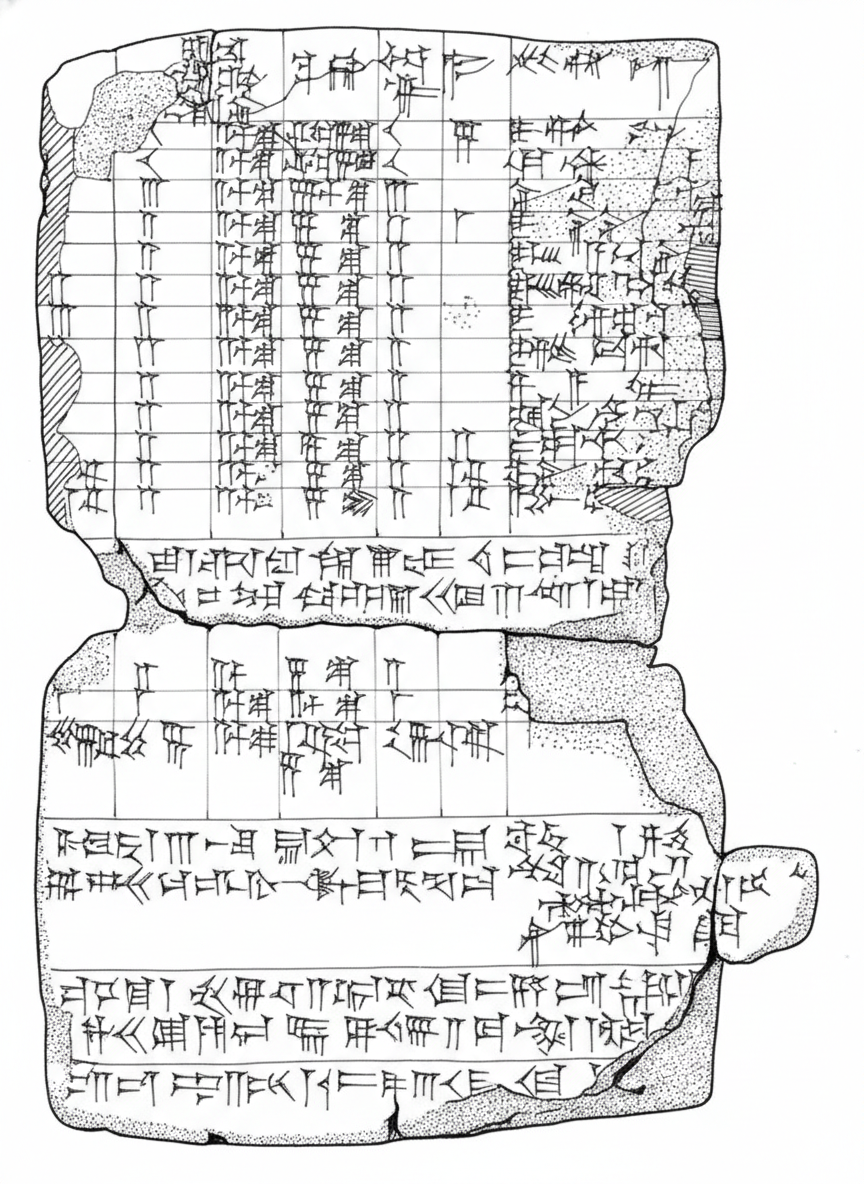
The simplest form of data is tabular data. The first known examples of data tables are 4000 years old (!) dating back to the Old Babylonian period. Then, these clay tablets were used for accounting and trade.
6.1 The Anatomy of a Table
Tables are made of columns and rows.
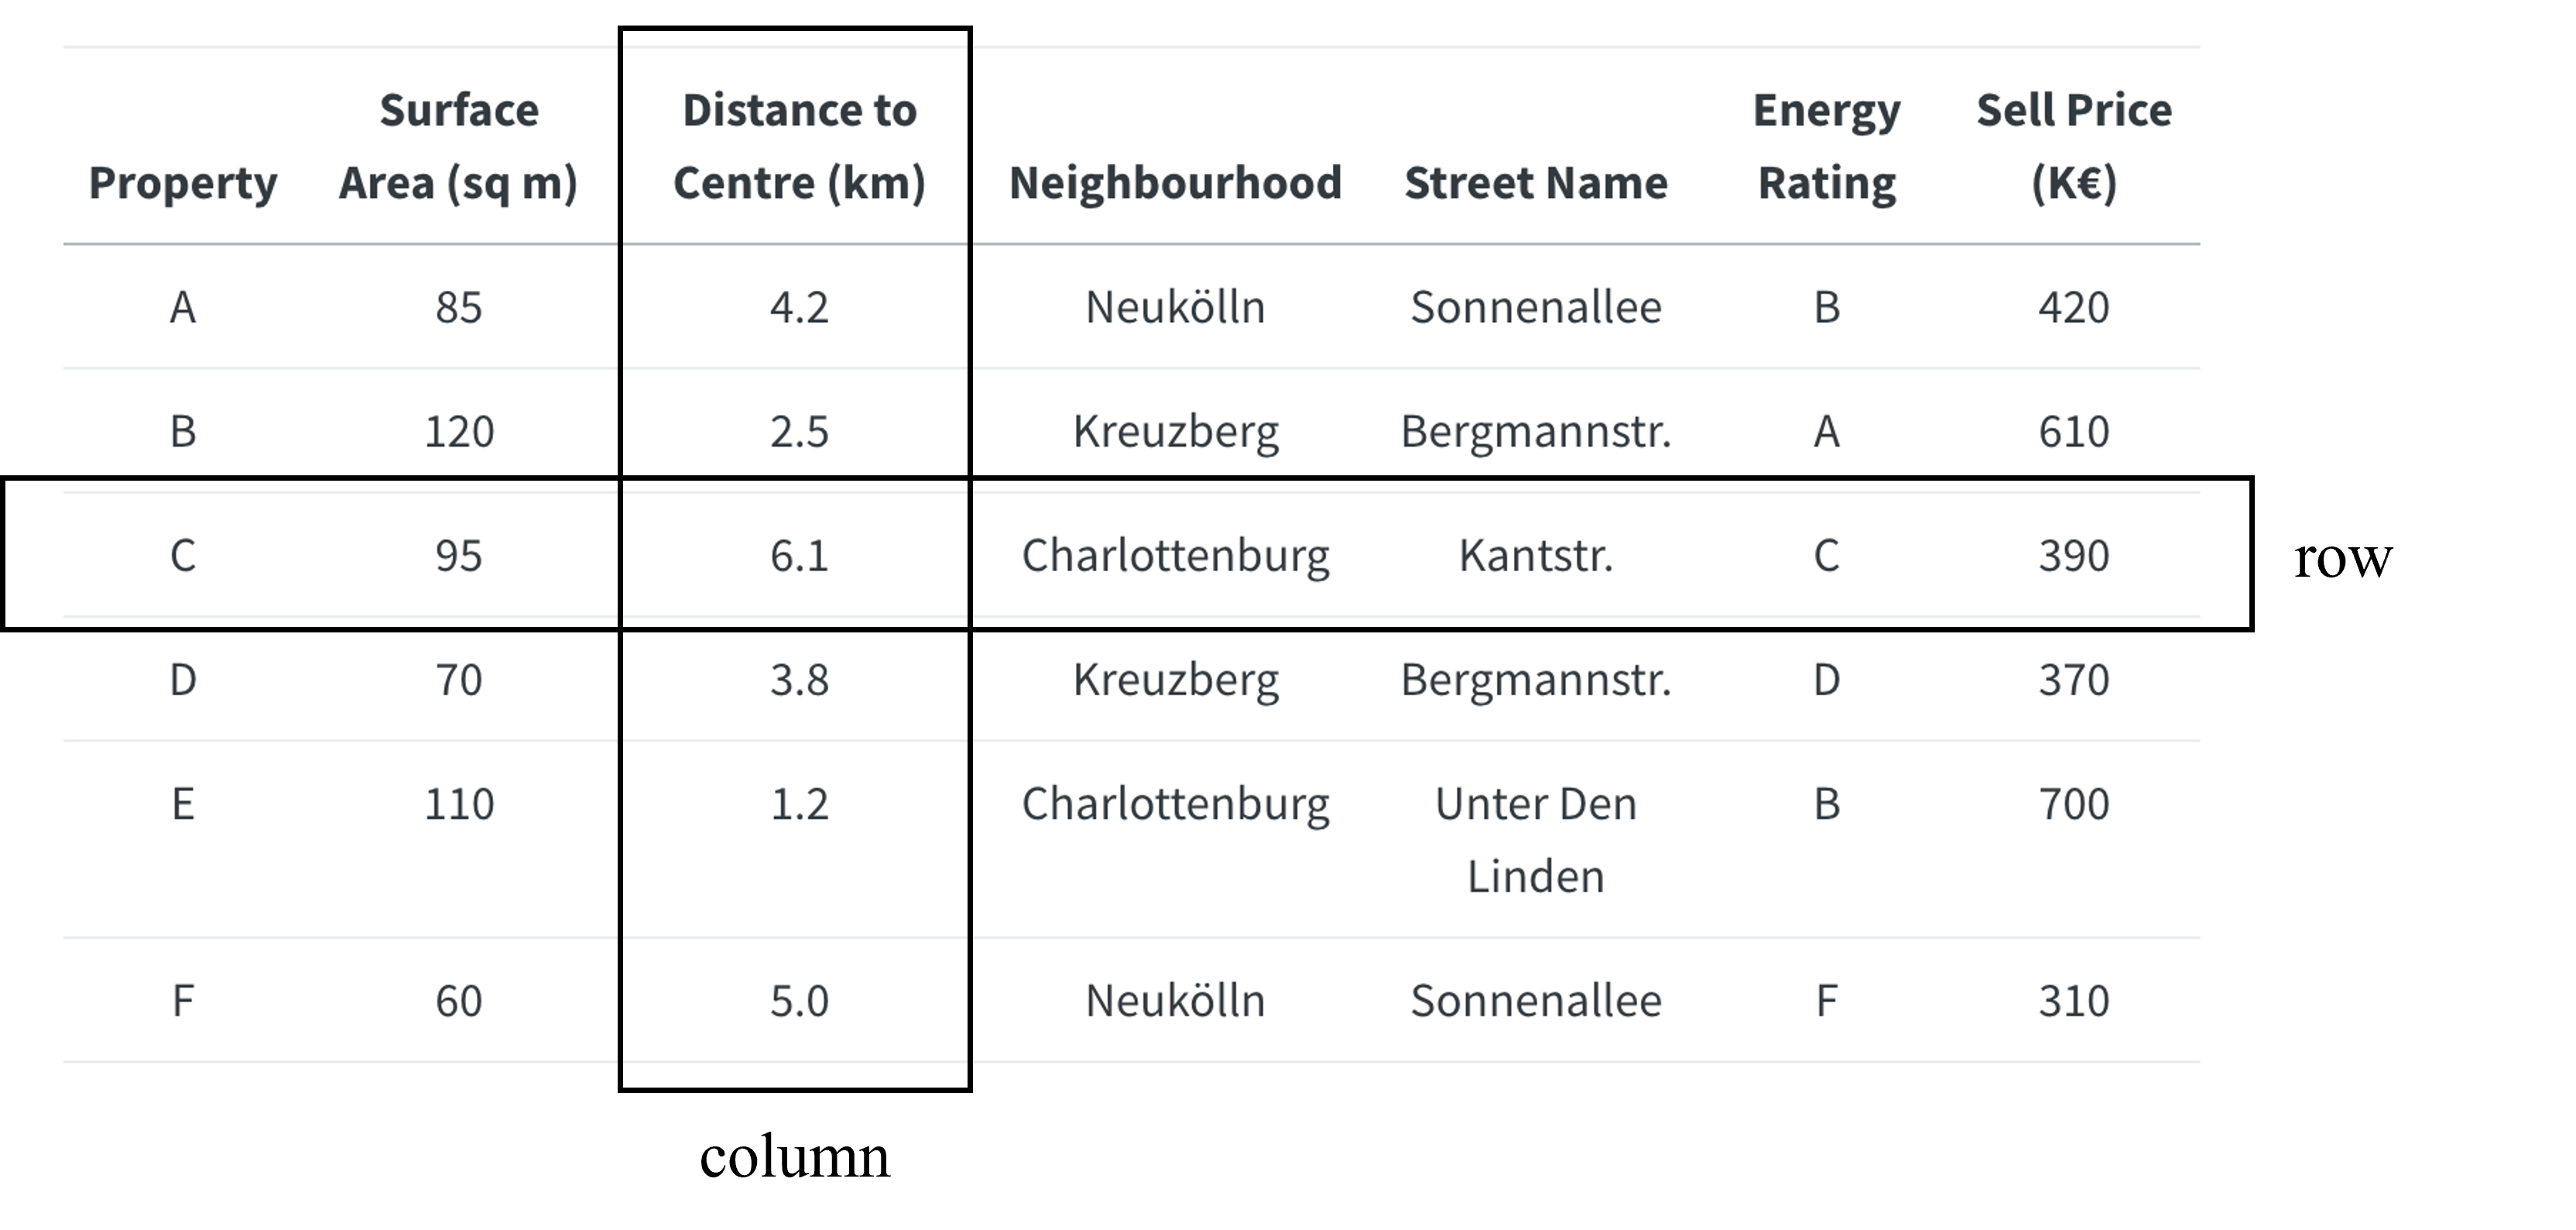
Rows generally represent a real-world entity, with columns describing the attributes of this entity. Here, each row is a property, and each column describes an attribute of this property.
As shown in this table, the values stored in tables can have different data types:
- numeric: integer or continuous values
- categorical: text or category
- boolean: true or false
- datetime: representing a point in time
In the case of the example above, the label to predict is the “Sale Price (€)” column.
In most organisations today, tabular data is stored in relational databases, also called Relational Database Management Systems. It is a mouthful, frequently abbreviated as RDBMS, still a mouthful.
6.2 Data is Anything Stored
Data is any piece of information that is recorded. The text that I am typing now is data. The signal sent from my laptop keyboard strokes, to the CPU, and over a network to Google Docs… All of this is data.
To put some structure to this, the following are the main data modalities:
- Images: generally represented as grids of pixel (Picture Elements) values
- Audio: sound wave, amplitude of a signal over time
- Video: a combination of frames and one or more audio tracks
- Text: sequence of characters, each encoded as bits
- Binary files: any file stored with bits, sequence of 0s and 1s
The above data types are ultimately stored as binary data on a computer. Some, like text files, are human-readable, while others—such as images, audio, and video—are often stored in binary file formats that are not directly readable by humans.
This book will focus on building an intuition for Machine Learning using tabular data only.
6.3 From Data to Space
Getting back to tabular data, these first sections will focus on numerical columns. Categorical and datetime features will be explored in the later sections. Spoiler alert: they will all be converted to numbers.
Looking at the table below, each tumour can be represented by a list of its characteristics, a list of numbers.
| Diagnosis | Perimeter Mean | Area Mean | Texture Mean |
|---|---|---|---|
| Benign | 80 | 700 | 17.5 |
| Malignant | 110 | 1200 | 23.0 |
In Mathematics, a list of numbers can represent a point in space. In the example above, each tumour is associated with three numbers. We can use these numbers to represent each tumour as a point in a three-dimensional space.
This is a fascinating question. The short answer is: a set with a degree of structure. A set can be thought of as a collection. But any set is not necessarily a space, as spaces require structure.
As an example, I can see objects on my desk: a glass of water and my notebook. These objects lie somewhere in a three dimensional space, with a certain position with regards to my computer. Using these positions, I could compute the distance between the different objects in space around me. But there, we are already getting carried away.
Below are two charts plotting suspicious mass observations in two and three dimensions:
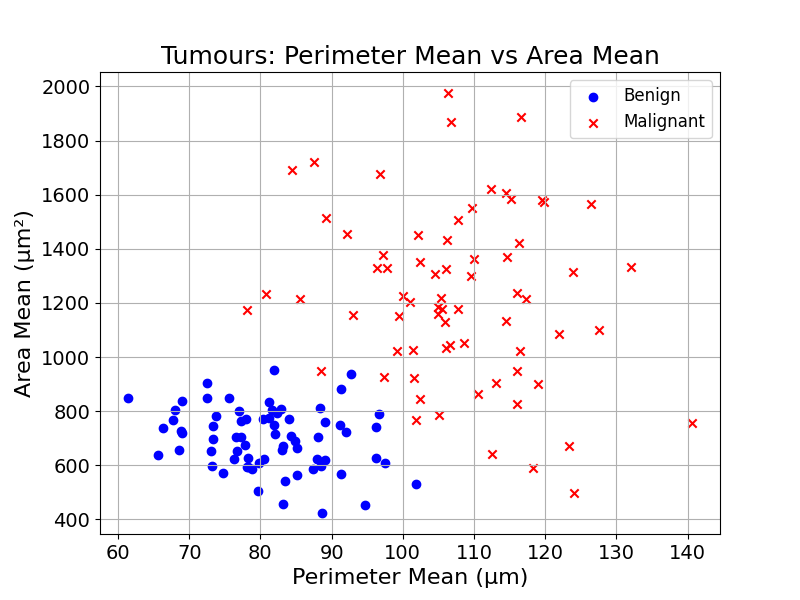
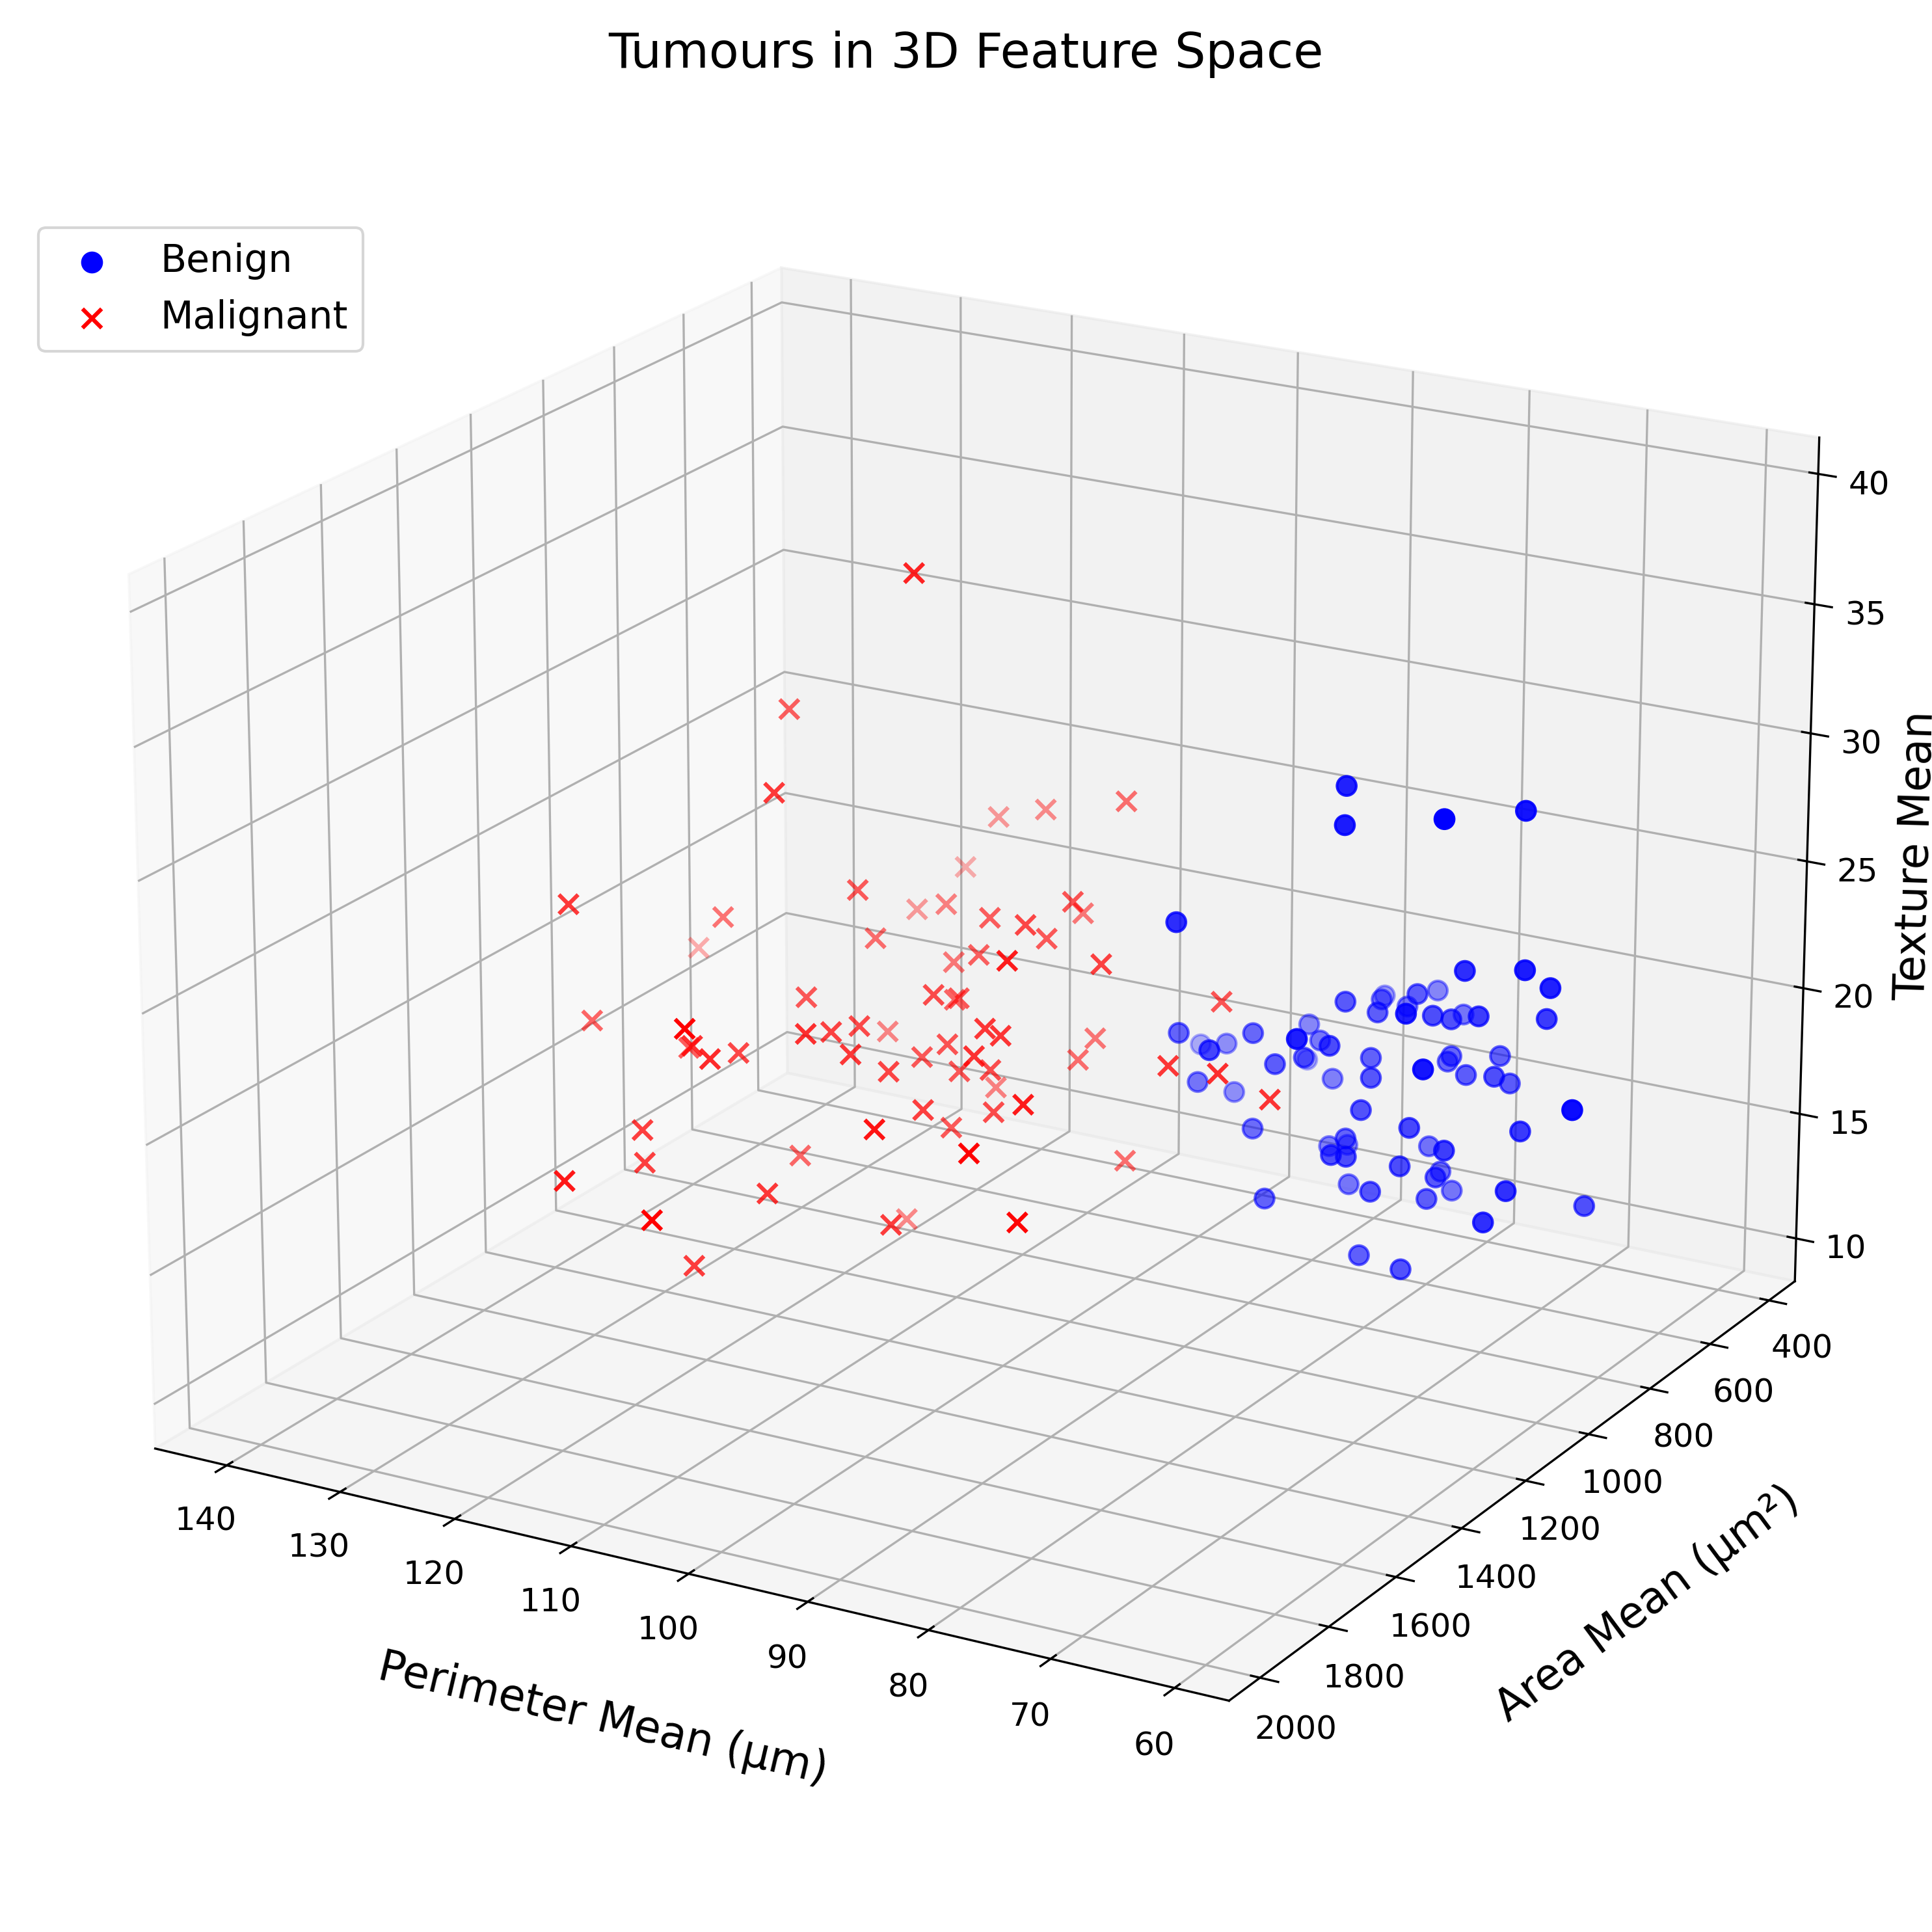
This text is printed on a flat surface. And yet, using perspective and transparency, one can create the illusion of a third dimension. If you think that this 3D chart is barely legible, I agree with you.
What is true in a two- and three-dimensional space also applies to any number of dimensions. As the number of dimensions increases, plotting data on paper gets more difficult.
6.4 Final Thoughts
But why do we bother with space and with these lists of numbers? Representing entities and observations in this way allows us to use mathematical tricks to make predictions. The nature of these tools will be studied in the next sections, starting with distance, and answering the question: how similar are two observations?